# Load Packages
library(tidyverse)
library(wehoop)
library(hoopR)
library(ggplot2)
library(plotly)
library(hrbrthemes)
library(scales)

# Bring in 2024 season data
wnba_player_box <- wehoop::load_wnba_player_box(seasons = 2024)
wnba_team_box <- wehoop::load_wnba_team_box(seasons = 2024)Introduction
This post shows the code for my analysis of Caitlin Clark’s historic 2024 WNBA season.
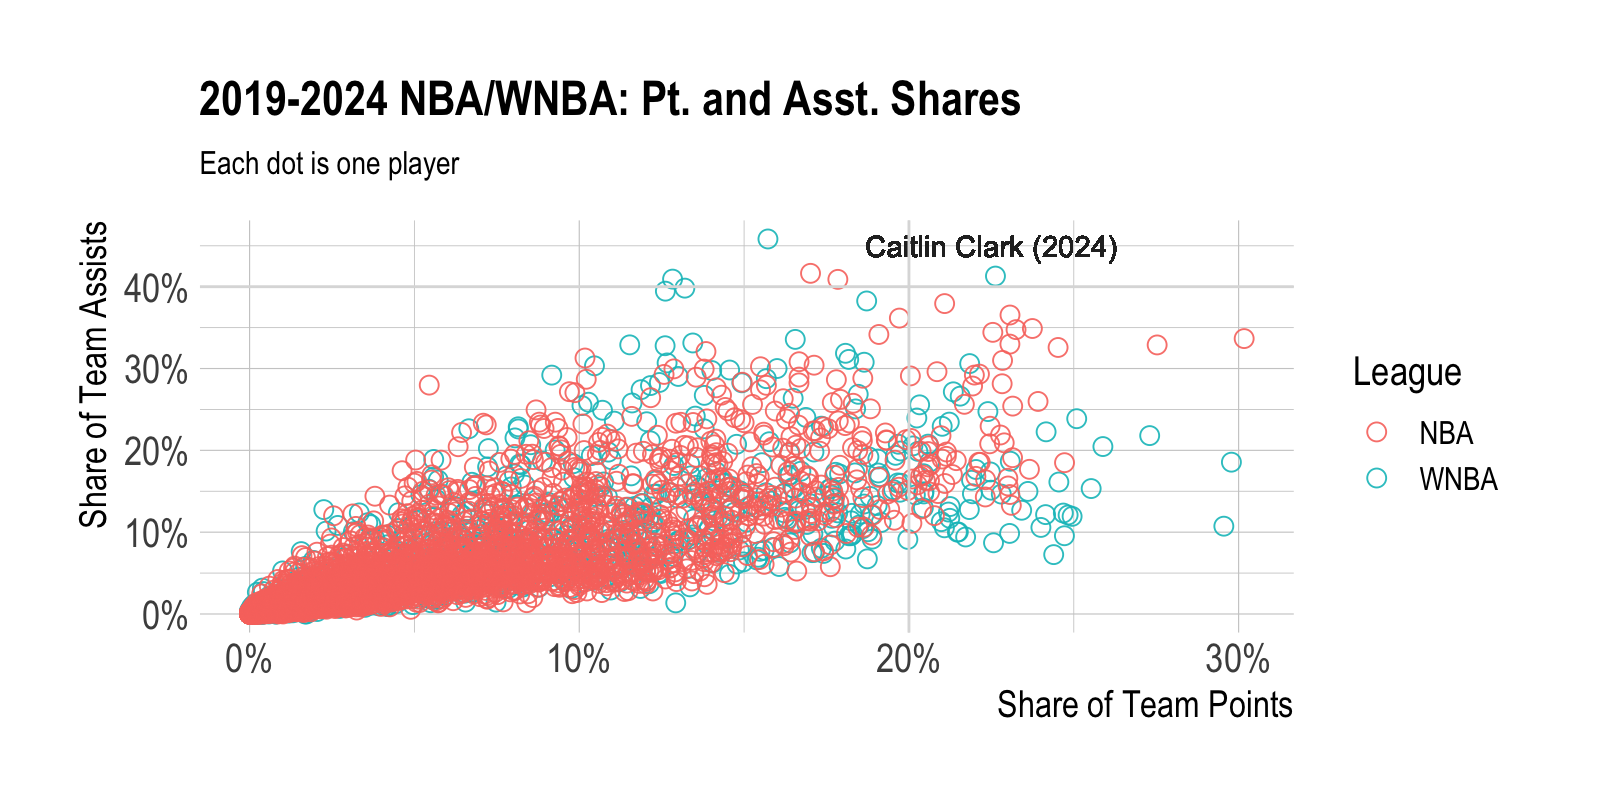
I calculated two metrics ‘point shares’ (the percentage of a team’s total points that a player accounts for) and ‘assist shares’ (the percentage of a team’s total assists that a player accounts for) to compare Clark to the last five seasons of both WNBA and NBA data.
The result are these cool scatterplots with NBA and WNBA players’ offensive production in relation to their teams’ output. Incredibly, Clark was the only WNBA or NBA player to account for 40% of their team’s assists and 20% of the team’s points in a season in the last five years.
Import WNBA Data
2024 WNBA Season Analysis
# Total points and assist in 2024 season
wnba_player_box$athlete_id <- as.character(wnba_player_box$athlete_id)

wnba_pts_assists <- wnba_player_box %>%
  filter(did_not_play == FALSE,
         game_id != '401620458') %>%
  group_by(athlete_id, athlete_display_name, team_id) %>%
  summarize(total_points = sum(points),
            total_assists = sum(assists)) %>%
  arrange(desc(total_points))

wnba_team_pts_assists <- wnba_team_box %>%
  filter(game_id != '401620458') %>%
  group_by(team_id, team_display_name) %>%
  summarize(
    total_assists = sum(assists),
    total_points = sum(team_score)
  ) %>%
  arrange(desc(total_points))

# Join player and team dfs together
player_and_team <- merge(x = wnba_pts_assists,
                         y = wnba_team_pts_assists,
                         by.x = "team_id",
                         by.y = "team_id")


# Calculate share of team points and assists
player_and_team <- player_and_team %>%
  rename(
    team_assists = total_assists.y,
    team_points = total_points.y
  ) %>%
  mutate(
    assist_share = total_assists.x/team_assists,
    points_share = total_points.x/team_points
  )
Scatterplot
# Create scatterplot of points and assists shares
wnba2024 <- ggplot(player_and_team, aes(x = points_share, y = assist_share)) +
  geom_point(color = "black", fill = "cornflowerblue", size = 3, shape = 21, alpha = 0.5) +
  labs(title = "2024 WNBA Season: Points and Assists Shares",
       subtitle = "Each dot is one player",
       x = "Share of Team Points",
       y = "Share of Team Assists") +
  scale_y_continuous(labels = scales::percent_format(accuracy = 1)) +
  scale_x_continuous(labels = scales::percent_format(accuracy = 1)) +
  theme_ipsum(base_size = 15, axis_title_size = 14) +
  geom_text(x=.225, y=.38, label="Caitlin Clark", color = "gray16")  +
  geom_text(x=.285, y=.08, label="A'ja Wilson", color = "gray16") +
  geom_text(x=.135, y=.378, label="Alyssa Thomas", color = "gray16")

# Show plot
wnba2024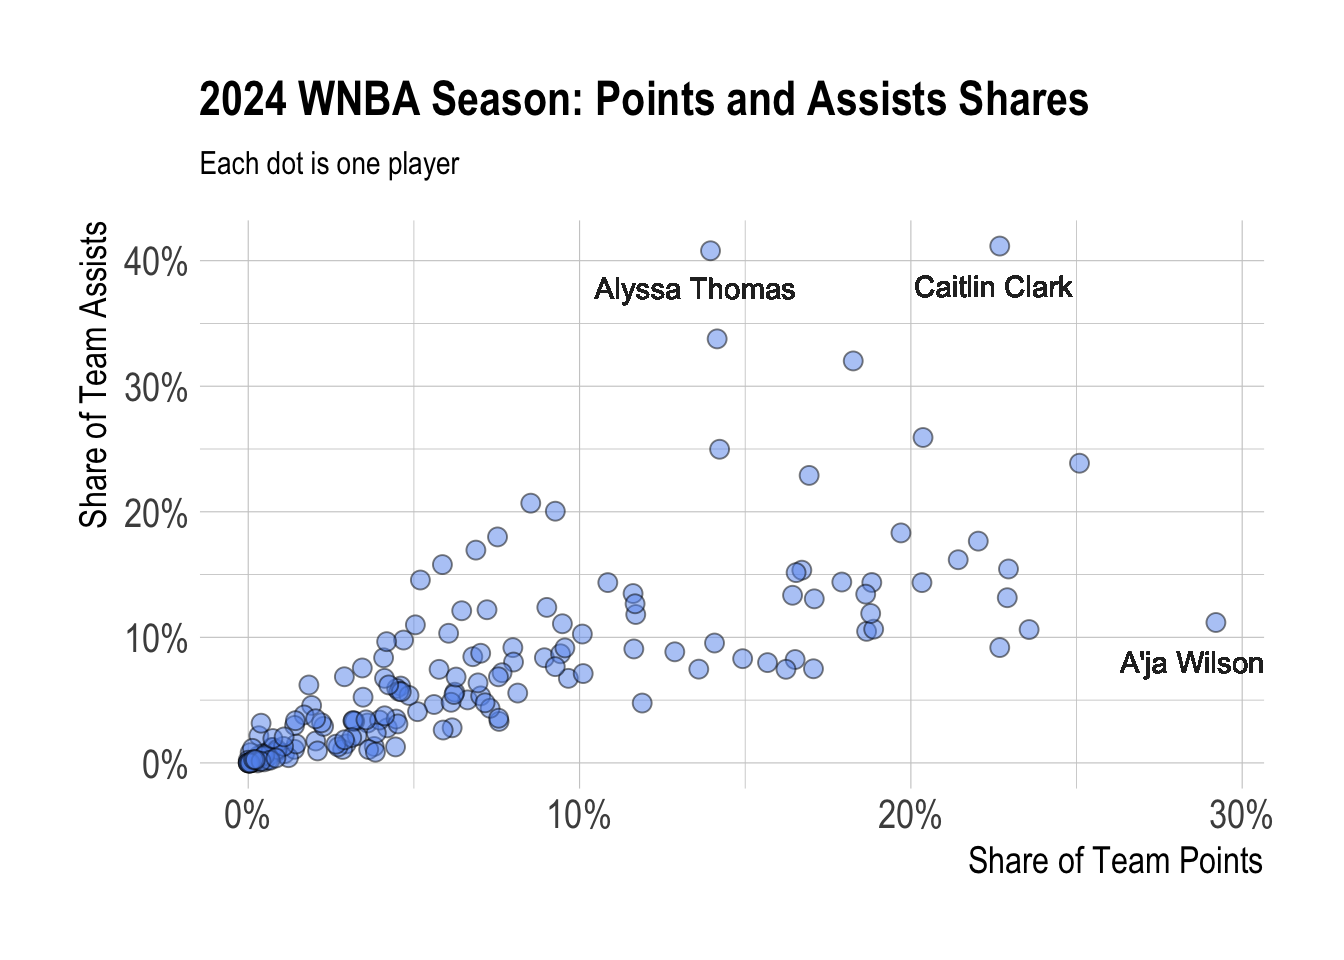
2019-2024 WNBA Season Analysis
# All WNBA Seasons Data

hist_wnba_player_box <- wehoop::load_wnba_player_box(seasons = 2019:2024)
hist_wnba_team_box <- wehoop::load_wnba_team_box(seasons = 2019:2024)

# Clean data: remove All-Star games' data and only use regular season data

all_star_teams <- c(
  "EAST",
  "WEST",
  "Team Parker",
  "Team Delle Donne",
  "Team Wilson",
  "Team Usa",
  "Team WNBA",
  "Team Stewart",
  "Team USA"
)

hist_wnba_player_box <- hist_wnba_player_box %>%
  filter(
    !team_display_name %in% all_star_teams,
    season_type == 2
  )

hist_wnba_team_box <- hist_wnba_team_box %>%
  filter(
    !team_display_name %in% all_star_teams,
    season_type == 2
  )

# Calculate total points and assists in season
hist_wnba_pts_assists <- hist_wnba_player_box %>%
  filter(did_not_play == FALSE) %>%
  group_by(season, athlete_id, athlete_display_name, team_id) %>%
  summarize(total_points = sum(points),
            total_assists = sum(assists)) %>%
  arrange(desc(total_points))


hist_wnba_team_pts_assists <- hist_wnba_team_box %>%
  group_by(season, team_id, team_display_name) %>%
  summarize(
    total_assists = sum(assists),
    total_points = sum(team_score)
  ) %>%
  arrange(desc(total_points))


# Join historical team and player data together
hist_player_and_team <- merge(x = hist_wnba_pts_assists,
                              y = hist_wnba_team_pts_assists,
                              by.x = c("season", "team_id"),
                              by.y = c("season","team_id"))

# Calculate share of team points and assists
hist_player_and_team <- hist_player_and_team %>%
  rename(
    team_assists = total_assists.y,
    team_points = total_points.y
  ) %>%
  mutate(
    assist_share = total_assists.x/team_assists,
    points_share = total_points.x/team_points
  )
Scatterplot
# historical scatterplot
wnba_2019_2024 <- ggplot(hist_player_and_team, aes(x = points_share, y = assist_share)) +
  geom_point(color = "black", fill = "cornflowerblue", size = 3, shape = 21, alpha = 0.5) +
  labs(title = "2019-2024 WNBA: Points and Assists Shares",
       subtitle = "Each dot is one player",
       x = "Share of Team Points",
       y = "Share of Team Assists") +
  scale_y_continuous(labels = scales::percent_format(accuracy = 1)) +
  scale_x_continuous(labels = scales::percent_format(accuracy = 1)) +
  theme_ipsum(base_size = 15, axis_title_size = 14) +
  geom_text(x=.225, y=.45, label="Caitlin Clark (2024)", color = "gray16")

# Show plot
wnba_2019_2024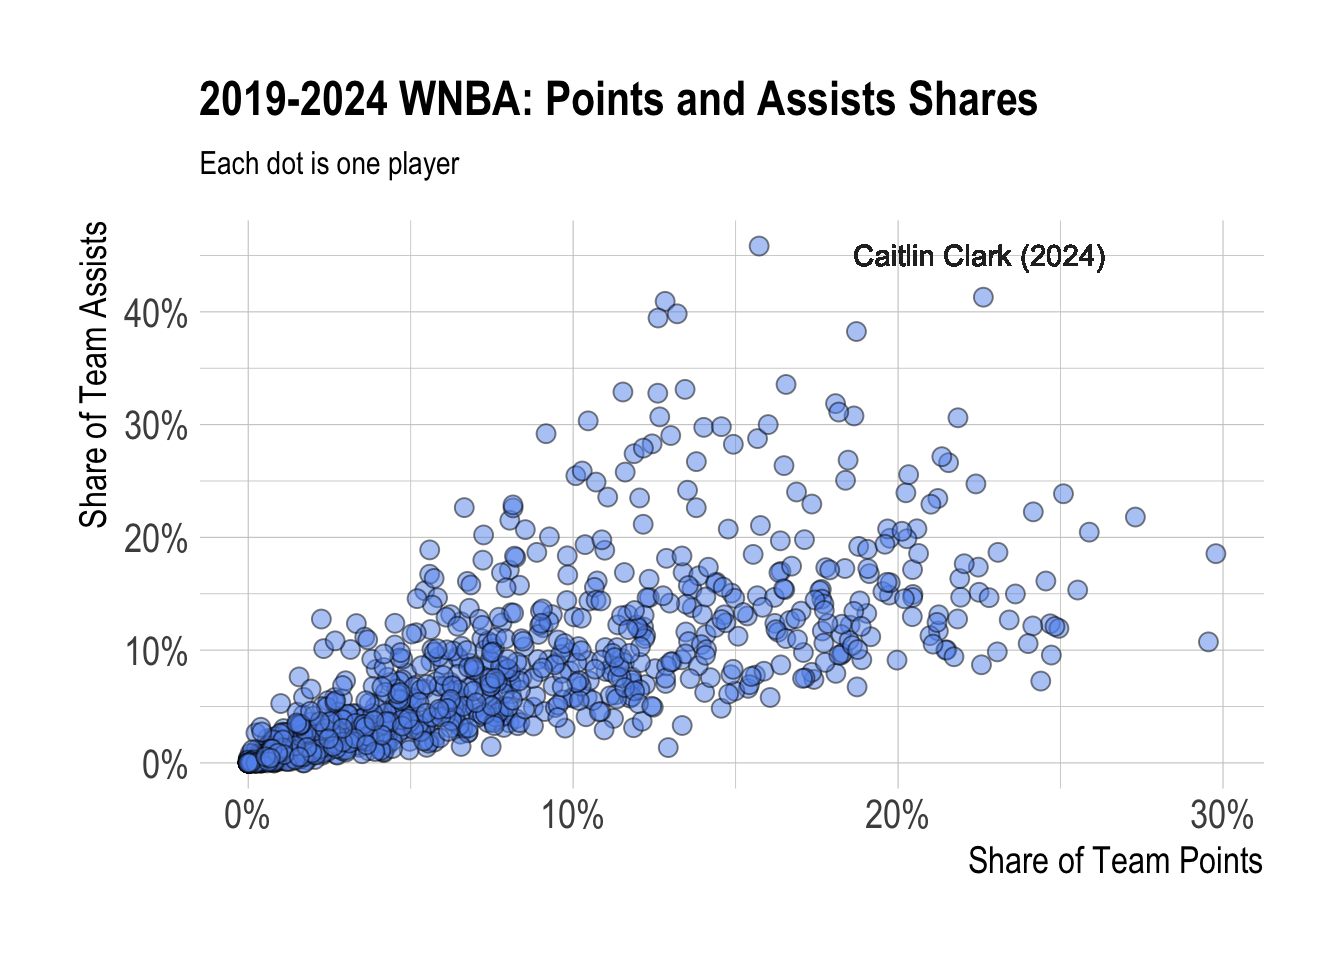
NBA Comparison
# Load NBA data for comparison

hist_nba_player_box <- load_nba_player_box(seasons = 2019:2024)
hist_nba_team_box <- load_nba_team_box(seasons = 2019:2024)

# Clean data: remove All-Star games' data and only use regular season data

unique(hist_nba_player_box$team_display_name)
[1] "Toronto Raptors" "Golden State Warriors" "Milwaukee Bucks"
[4] "Portland Trail Blazers" "Denver Nuggets" "Philadelphia 76ers"
[7] "Houston Rockets" "Boston Celtics" "San Antonio Spurs"
[10] "LA Clippers" "Utah Jazz" "Orlando Magic"
[13] "Brooklyn Nets" "Oklahoma City Thunder" "Detroit Pistons"
[16] "Indiana Pacers" "Atlanta Hawks" "Miami Heat"
[19] "Charlotte Hornets" "New York Knicks" "Chicago Bulls"
[22] "Memphis Grizzlies" "Dallas Mavericks" "Minnesota Timberwolves"
[25] "Sacramento Kings" "Cleveland Cavaliers" "Washington Wizards"
[28] "New Orleans Pelicans" "Phoenix Suns" "Los Angeles Lakers"
[31] "Team LeBron" "Team Giannis" "World"
[34] "USA" "Team Durant" "Western Conf All-Stars"
[37] "Eastern Conf All-Stars"nba_all_star_teams <- c(
"Eastern Conf All-Stars",
"Western Conf All-Stars",
"Team LeBron",
"Team Stephen",
"World",
"USA",
"Team Giannis",
"Leb",
"Usa",
"Team Durant"
)
hist_nba_player_box <- hist_nba_player_box %>%
filter(
!team_display_name %in% nba_all_star_teams,
season_type == 2
)
hist_nba_team_box <- hist_nba_team_box %>%
filter(
!team_display_name %in% nba_all_star_teams,
season_type == 2
)
# Calculate total points and assists in season
hist_nba_pts_assists <- hist_nba_player_box %>%
filter(did_not_play == FALSE) %>%
group_by(season, athlete_id, athlete_display_name, team_id) %>%
summarize(total_points = sum(points),
total_assists = sum(assists)) %>%
arrange(desc(total_points))
hist_nba_team_pts_assists <- hist_nba_team_box %>%
group_by(season, team_id, team_display_name) %>%
summarize(
total_assists = sum(assists),
total_points = sum(team_score)
) %>%
arrange(desc(total_points))
# Join team and player data
hist_nba_player_and_team <- merge(x = hist_nba_pts_assists,
y = hist_nba_team_pts_assists,
by.x = c("season", "team_id"),
by.y = c("season","team_id"))
# Calculate nba share of team points and assists
hist_nba_player_and_team <- hist_nba_player_and_team %>%
rename(
team_assists = total_assists.y,
team_points = total_points.y
) %>%
mutate(
assist_share = total_assists.x/team_assists,
points_share = total_points.x/team_points
)
# Add "League" column
hist_player_and_team <- hist_player_and_team %>%
mutate(
League = "WNBA"
)
hist_nba_player_and_team <- hist_nba_player_and_team %>%
mutate(
League = "NBA"
)
# Union WNBA and NBA data together
nba_wnba_combined <- rbind(hist_player_and_team, hist_nba_player_and_team)
# Load NBA data for comparison
hist_nba_player_box <- load_nba_player_box(seasons = 2019:2024)
hist_nba_team_box <- load_nba_team_box(seasons = 2019:2024)
# Clean data: remove All-Star games' data and only use regular season data
unique(hist_nba_player_box$team_display_name) [1] "Toronto Raptors" "Golden State Warriors" "Milwaukee Bucks"
[4] "Portland Trail Blazers" "Denver Nuggets" "Philadelphia 76ers"
[7] "Houston Rockets" "Boston Celtics" "San Antonio Spurs"
[10] "LA Clippers" "Utah Jazz" "Orlando Magic"
[13] "Brooklyn Nets" "Oklahoma City Thunder" "Detroit Pistons"
[16] "Indiana Pacers" "Atlanta Hawks" "Miami Heat"
[19] "Charlotte Hornets" "New York Knicks" "Chicago Bulls"
[22] "Memphis Grizzlies" "Dallas Mavericks" "Minnesota Timberwolves"
[25] "Sacramento Kings" "Cleveland Cavaliers" "Washington Wizards"
[28] "New Orleans Pelicans" "Phoenix Suns" "Los Angeles Lakers"
[31] "Team LeBron" "Team Giannis" "World"
[34] "USA" "Team Durant" "Western Conf All-Stars"
[37] "Eastern Conf All-Stars"nba_all_star_teams <- c(
"Eastern Conf All-Stars",
"Western Conf All-Stars",
"Team LeBron",
"Team Stephen",
"World",
"USA",
"Team Giannis",
"Leb",
"Usa",
"Team Durant"
)
hist_nba_player_box <- hist_nba_player_box %>%
filter(
!team_display_name %in% nba_all_star_teams,
season_type == 2
)
hist_nba_team_box <- hist_nba_team_box %>%
filter(
!team_display_name %in% nba_all_star_teams,
season_type == 2
)
# Calculate total points and assists in season
hist_nba_pts_assists <- hist_nba_player_box %>%
filter(did_not_play == FALSE) %>%
group_by(season, athlete_id, athlete_display_name, team_id) %>%
summarize(total_points = sum(points),
total_assists = sum(assists)) %>%
arrange(desc(total_points))
hist_nba_team_pts_assists <- hist_nba_team_box %>%
group_by(season, team_id, team_display_name) %>%
summarize(
total_assists = sum(assists),
total_points = sum(team_score)
) %>%
arrange(desc(total_points))
# Join team and player data
hist_nba_player_and_team <- merge(x = hist_nba_pts_assists,
y = hist_nba_team_pts_assists,
by.x = c("season", "team_id"),
by.y = c("season","team_id"))
# Calculate nba share of team points and assists
hist_nba_player_and_team <- hist_nba_player_and_team %>%
rename(
team_assists = total_assists.y,
team_points = total_points.y
) %>%
mutate(
assist_share = total_assists.x/team_assists,
points_share = total_points.x/team_points
)
# Add "League" column
hist_player_and_team <- hist_player_and_team %>%
mutate(
League = "WNBA"
)
hist_nba_player_and_team <- hist_nba_player_and_team %>%
mutate(
League = "NBA"
)
# Union WNBA and NBA data together
nba_wnba_combined <- rbind(hist_player_and_team, hist_nba_player_and_team)NBA-WNBA Scatterplot
nba_wnba_plot <- ggplot(nba_wnba_combined, aes(x = points_share, y = assist_share, color = League)) +
  geom_point(size = 3, shape = 21, alpha = 0.9) +
  labs(title = "2019-2024 NBA/WNBA: Pt. and Asst. Shares",
       subtitle = "Each dot is one player",
       x = "Share of Team Points",
       y = "Share of Team Assists") +
  scale_y_continuous(labels = scales::percent_format(accuracy = 1)) +
  scale_x_continuous(labels = scales::percent_format(accuracy = 1)) +
  theme_ipsum(base_size = 15, axis_title_size = 14) +
  geom_text(x=.225, y=.45, label="Caitlin Clark (2024)", color = "gray16") +
  geom_hline(yintercept = .40, color = "gainsboro") +
  geom_vline(xintercept = .20, color = "gainsboro")

# Show plot
nba_wnba_plot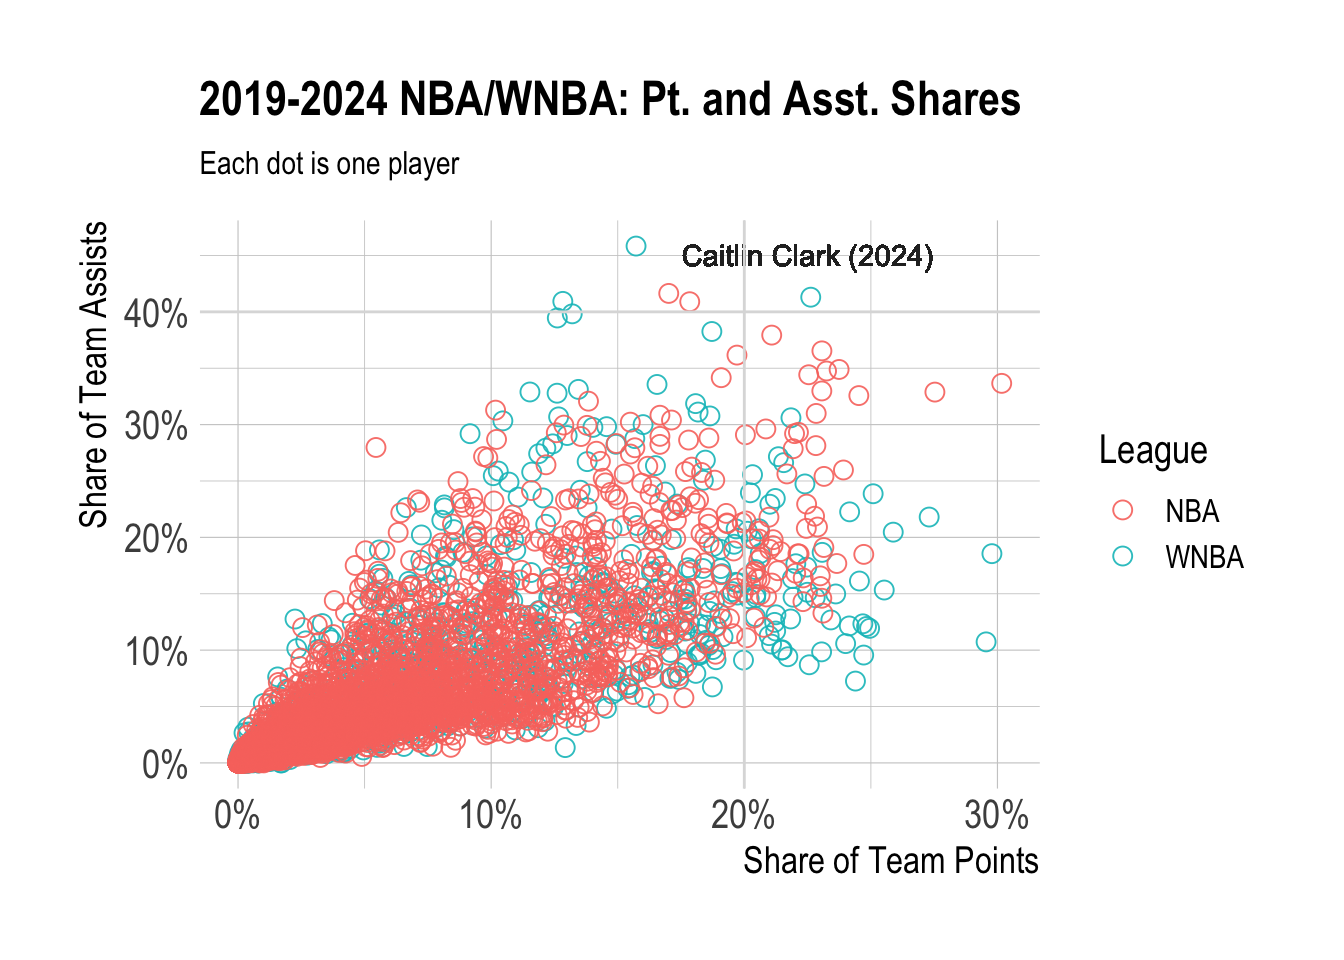
Final Interactive NBA-WNBA Scatterplot
# Interactive plot

p <- ggplot(nba_wnba_combined, aes(x = points_share,
                                   y = assist_share,
                                   text = paste(athlete_display_name,
                                                season,
                                                "<br>Pt. Share:",
                                                round(points_share, 2),
                                                "<br>Asst. Share:",
                                                round(assist_share, 2)
                                   ),
                                   color = League)) +
  geom_point(size = 3, shape = 21, alpha = 0.75) +
  labs(title = "2019-2024 NBA/WNBA: Pt. and Asst. Shares",
       subtitle = "Each dot is one player",
       x = "Share of Team Points",
       y = "Share of Team Assists") +
  scale_y_continuous(labels = scales::percent_format(accuracy = 1)) +
  scale_x_continuous(labels = scales::percent_format(accuracy = 1)) +
  theme_ipsum(base_size = 15, axis_title_size = 14)

interactive_plot <- ggplotly(p, tooltip = "text")

# Show interactive plot
interactive_plot