Code
boxplot(Sepal.Length~Species,
        data=iris,
        main='Sepal Length by Species',
        xlab='Species',
        ylab='Sepal Length',
        col='steelblue',
        border='black')
October 21, 2024
Hey there! 👋
Welcome to my blog. Special thanks to Samantha Csik’s wonderful guide on setting up a blog on a Quarto website.
Don’t worry, I come in peace.
Data analyses in the blog posts on this site are usually conducted with the R coding language. To view the code that generates the analysis, click the “> Code” dropdown button above each chunk.
There is also a button on the top right corner of every post with code-folding enabled to globally expand or collapse all code chunks.
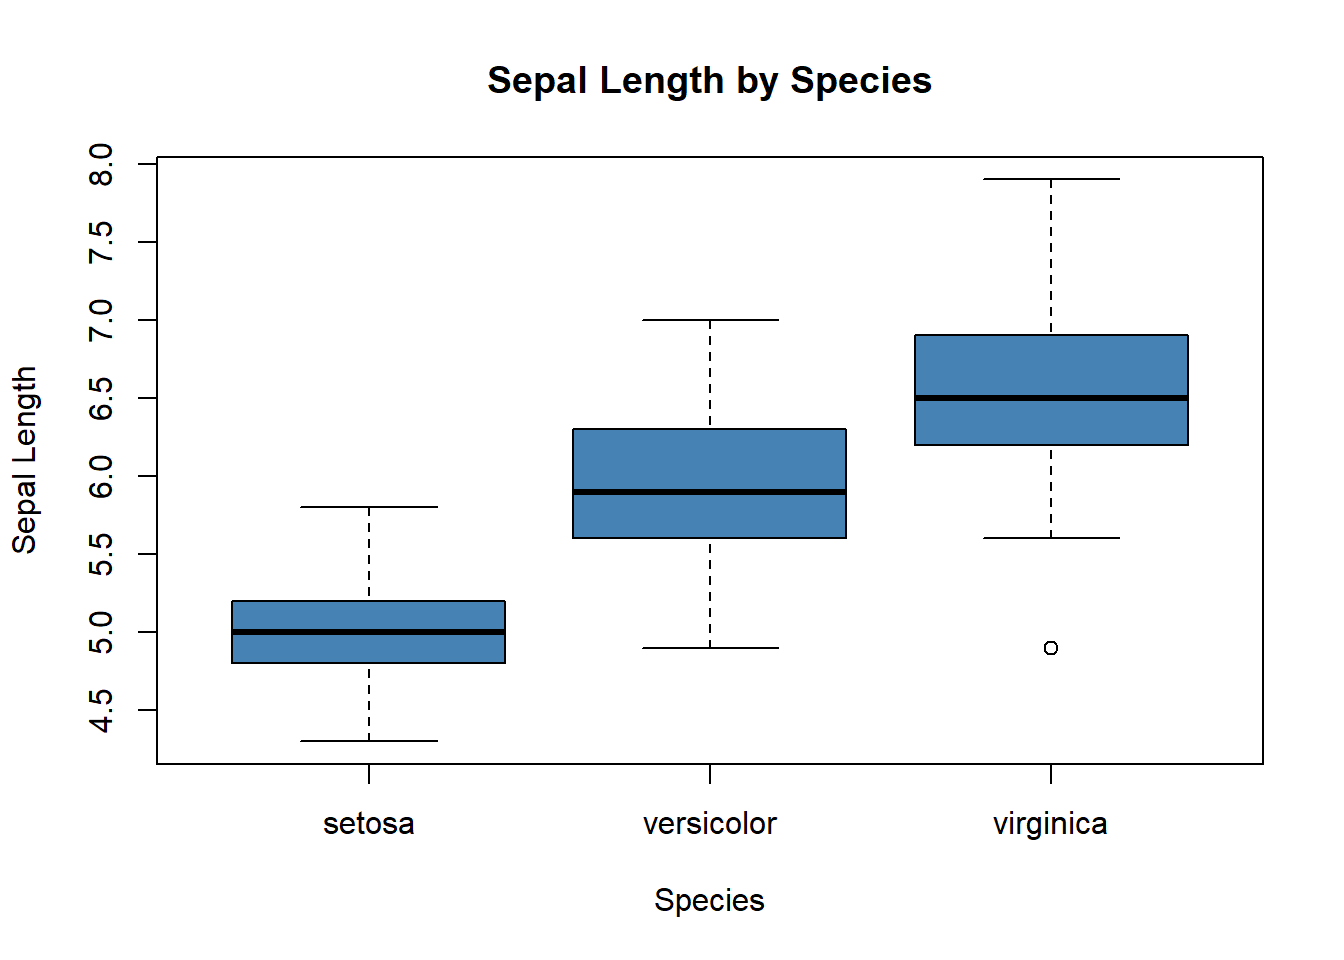
For example, the code that loads the iris dataset and generates the plot below can be expanded or collapsed by the “> Code” dropdown button.

It’s a useful feature of Quarto that allows for documents to be consumed easily by both technical and non-technical readers.
Happy reading 😁
---
title: "Hello, World"
description: "Welcome to my blog"
author:
  - name: Aaron Olson
    url: https://github.com/marginofaaron
date: 10-21-2024
categories: [Quarto, R] # self-defined categories
image: icomeinpeace.jpg
draft: false # setting this to `true` will prevent your post from appearing on your listing page until you're ready!
format:
  html:
    code-fold: true
    code-tools: true
    code-copy: true
execute:
  warning: false
  message: false
---

Hey there! 👋

Welcome to my blog. Special thanks to [Samantha Csik's wonderful guide](https://samanthacsik.github.io/posts/2022-10-24-quarto-blogs/) on setting up a blog on a Quarto website.

Don't worry, [I come in peace](https://www.youtube.com/watch?v=atUUjSLMSiM).

</br>

## 🔎 Viewing source code on this site

Data analyses in the blog posts on this site are usually conducted with the R coding language. To view the code that generates the analysis, click the **"\> Code"** dropdown button above each chunk.

There is also a button on the top right corner of every post with code-folding enabled to globally expand or collapse all code chunks.

### Code Chunk Example

For example, the code that loads the [iris](https://www.statology.org/iris-dataset-r/) dataset and generates the plot below can be expanded or collapsed by the **"\> Code"** dropdown button.

```{r}
#| label: iris-example
#| fig-cap: "A boxplot of the iris dataset"

boxplot(Sepal.Length~Species,
        data=iris,
        main='Sepal Length by Species',
        xlab='Species',
        ylab='Sepal Length',
        col='steelblue',
        border='black')


```

It's a [useful feature](https://quarto.org/docs/output-formats/html-code.html) of Quarto that allows for documents to be consumed easily by both technical and non-technical readers.

Happy reading 😁